Daily photo-dating browser game
Main Game Interface Challenge Results Challenges Archive

WhichYear challenges users to guess when photos were taken with a new challenge each day. A well-crafted UX drove its success in an oversaturated niche.

My Role

Sole researcher, designer, and developer.

Tools / Methods

Usability Testing User Interviews Figma React

Timeline

Feb '25
Project Start
Apr '25
Public Launch
Aug '25
Acquisition

KPIs

1M+
Total Plays
6K
Daily Users
30%
Share Rate
7MIN
Avg Engagement

A Genre With No Good Entry

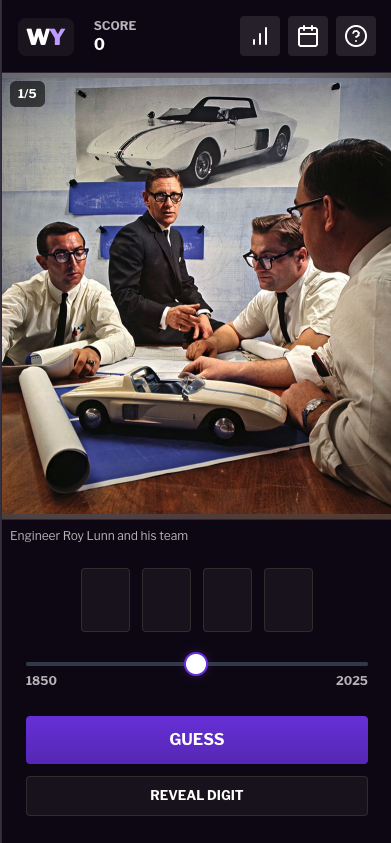
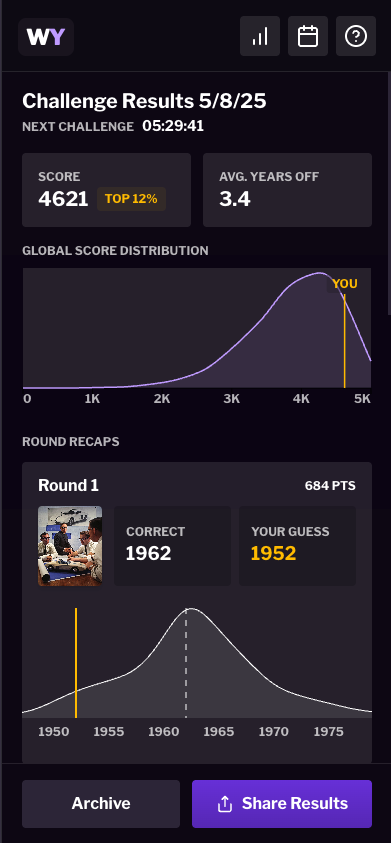
Photo-dating games already existed — and some had real audiences — but none of them were well-made. Confusing interfaces, ugly design, ad overload, and lifeless results screens were the norm. Players tolerated these issues because the core concept is genuinely fun: look at a photo, figure out when it was taken.

The opportunity wasn't to invent a new genre. It was to build the version that should have existed already — one where the UX was as engaging as the concept itself.

Key Solutions

A game that rewards observation, historical knowledge, and strategy.

Players guess the year each of the five photos were taken. Each photo contains clues - some are more "vibes" based, while others can be narrowed down based on specific details (a building under construction, a car shape change, etc). Users can reveal each digit place once per challenge. Points are awarded based on proximity to the actual year, with a special algorithm that highly rewards guesses within a few years.

“I enjoy the depth it adds in terms of deciding when to strategically deploy it, and for which digit”

ResetEra Comment

Compare your results to everyone else's. See how others guessed on each photo.

After submitting a challenge, the site shows a global score distribution graph, so users can see how they stack up. I used a kernel density estimation (KDE) to show granular detail. The app also displays the guess distribution for each photo, so players can see how others guessed. Users can also see their personal statistics.

Research

Players who read explanations improved 23% on subsequent similar photos. Scoring weights accuracy over speed to encourage thoughtful observation.

“Man I am in love. The global [score distribution graph] is inspired!”

Hackernews Comment

Share results in a fun, emoji-encoded format.

Sharing is easy - just tap the share button in the sticky footer to launch a native share dialog (or auto-copy results if you're on desktop). The plain-text results show your total score, percentile rank, and how close each of your guesses was (1-10 emojis for years off, bullseye for exact year)

Research

30% of users share their results. Many post theirs in forums or social media sites day after day, often in large daily threads, accompanied by bragging rights or lamentations.

Type a year or drag the slider. Both stay in sync.

Typing one digit advances you to the next (much like the best verification code inputs). When you use a digit reveal, the slider is limited to years that match the revealed digit. After guessing, the slider becomes a visualization of the year you guessed compared to the actual year.

Research

9/10 mobile testers used the slider, compared to 5/10 desktop testers. Some mobile testers typed the last digit manually, since the slider required too much precision.

“You can also just enter in the digits if you click on the date box, which I needed a few times”

ResetEra Comment

Pinch, click, double-tap, or scroll to zoom.

Different users are comfortable with different zoom methods. Some prefer to click and drag, some prefer to pinch, and some prefer to scroll. All are supported. Mobile zoom buttons appear at the bottom for minimal thumb strain.

Research

Initial test users struggled to zoom, as many of their devices didn't support pinch-to-zoom. After adding zoom buttons, all users were able to zoom to examine photo details.

Play more challenges while still having a reason to come back tomorrow.

Users can play as many past challenges as they want, but must return each day to play the latest. Initial users complained that they wanted to play more. Some suggested an infinite mode. But each challenge is curated to be unique and interesting, plus I didn't want users to binge play and get bored.

Organic Growth to Acquisition

I posted WhichYear on Reddit and shared it with a few friends. Within a week it had been picked up by MetaFilter, topped the Hacker News front page, and pulled in 25,000 users in a single day. Word-of-mouth sharing and daily return players drove steady growth from there.

Five months after launch, the site was acquired.

0
total plays

More case studies

Finvera

Fintech startup news site

  • UI Design
  • Front-End
Finvera

WalkupMatch

Spotify Wrapped meets MLB

  • UI Design
  • Full-Stack
WalkupMatch

Profile

Charge tracking software

  • UI Design
  • Front-End
Profile

TamaTracker

Skill progress tracker

  • UI Design
  • Motion Design
TamaTracker